
Three years ago at a tech conference in Austin, I watched a registration queue collapse into complete chaos. Not because of bad planning exactly, but because someone calculated queue space using the wrong density formula. They'd allocated 2.5 square feet per person based on elevator capacity standards. Problem was, conference attendees carrying bags, rolling cases, and laptops need closer to 8 square feet each when accounting for personal space and movement flow.
The registration backup cascaded through the entire morning schedule. Sessions started late, sponsors complained about reduced booth traffic, and the venue threatened penalties for fire code violations when the queue spilled into emergency exits. All from using the wrong geometric constant in their event queue management calculations.
Most queue planning fails before the event starts because planners treat crowds like static objects instead of dynamic flows. After building operational systems for everything from 300-person corporate summits to 15,000-person festivals, the same patterns emerge: bad math creates bad queues, and bad queues destroy event experiences faster than almost any other operational failure.
The Real Geometry of Queue Formations
Queue space isn't just length times width. Different queue types have completely different spatial requirements based on movement patterns and processing dynamics.
Linear queues need 7-9 square feet per person when people are stationary but require 11-13 square feet during active movement phases. Think about coffee lines where people shuffle forward every 30 seconds versus registration where people stand for minutes at a time. The geometry changes based on movement frequency.
Serpentine queues actually require more space per person — around 10-12 square feet — because of the turn radius requirements. Every switchback creates dead space where the queue doubles back on itself. A 100-person serpentine queue needs about 20% more total area than a straight line configuration.
Fan-out queues at multi-station processing points follow a different formula entirely. The queue width expands as people approach service points, creating a triangular footprint. For a 5-station registration desk, the queue naturally spreads from 6 feet wide at the back to 30 feet at the front. Most planners only calculate for the narrow end, then wonder why crowds bunch up at service points.
When peak arrival windows hit, effective density increases by 1.4x to 1.8x because people compress when they sense competition for position. That 8 square feet per person becomes 5.5 square feet during the 30-minute rush before keynotes.
Modular Signage That Actually Controls Flow
Standard event signage fails because it assumes people read signs. They don't. Behavioral observation across hundreds of events shows maybe 30% of attendees actually process written queue instructions. The rest follow visual cues and crowd momentum.
Eliminate event chaos with Festoly.
Manage every aspect of your event seamlessly — from planning to execution.
- Centralized event scheduling
- Real-time attendee tracking
- Vendor & resource coordination
No credit card required
The modular approach uses three signage layers working together:
Macro markers visible from 50+ feet establish queue existence and general direction. These need to be 4 feet tall minimum with high-contrast colors. Not text — just arrows and universal symbols. Yellow for general queues, red for VIP, blue for accessibility routes.
Channel indicators every 10-15 feet maintain queue boundaries. Stanchions work but create trip hazards during surges. Flexible barrier systems using weighted bases and retractable belts adapt better to crowd pressure. The key measurement: barriers should withstand 30 pounds of lateral force without tipping.
Micro signs at eye level every 20 feet provide actual instructions. Processing time estimates, required documents, accepted payment methods. These signs need duplicate positioning at both standing height (5.5 feet) and seated/wheelchair height (3.5 feet). ADA compliance aside, 40% of your queue will be looking at phones, effectively dropping their sight line by 2 feet.
Place micro signs at both standing (5.5 ft) and seated/wheelchair (3.5 ft) heights to cover most sight lines.
The modular library approach means pre-fabricating sign combinations for different queue scenarios. Registration gets configuration A (macro arrows, document checklist, processing time). Food service gets configuration B (menu boards, payment types, allergen notices). Merchandise gets configuration C (item limits, return policy, express lane criteria).
Each module needs QR codes linking to real-time queue status. Not for some fancy digital experience — because when queues extend beyond sight lines, people need to know if they're in the right line before investing 20 minutes standing there.
Staffing Thresholds Based on Processing Math
Queue staff requirements follow predictable ratios once you understand processing velocity versus arrival rate dynamics.
Standard processing scenarios break down into time blocks:
-
Simple badge pickup
30-45 seconds per person
-
Registration with payment
2-3 minutes per person
-
Credential verification with waivers
3-4 minutes per person
-
Multi-step processes (reg + badge + swag)
4-6 minutes per person
From these base rates, the staffing formula emerges: Required stations = (Peak arrival rate × Processing time) / Acceptable wait threshold For a 1,000-person conference with 40% arriving in the first hour (400 people), each taking 2 minutes to process, with a 10-minute acceptable wait: Stations needed = (400/60 × 2) / 10 = 13.3 / 10 = 1.33 = 2 stations minimum
Flow controllers at 1 per 75 people in queue keep lines moving and handle questions that would otherwise slow processing. They prevent the single confused attendee from blocking an entire station for 10 minutes.
Surge directors activate at 1 per 150 people when queues exceed normal capacity. Their job isn't customer service — it's pure traffic management, splitting queues, opening overflow processing, and preventing dangerous compression.
Float staff at 20% of base staffing switch between roles as needed. When registration queue clears, they shift to session check-in. When merchandise lines surge, they open express lanes for exact-change transactions.
Threshold triggers need hard numbers, not subjective assessment. When queue depth exceeds 30 people: add flow controller. When wait time exceeds 15 minutes: activate surge protocols. When physical queue space reaches 80% capacity: implement overflow routing.
Rapid Response Protocols for Surge Events
Surge response fails when treated as an emergency instead of an expected operational state. Every event experiences micro-surges — the 15 minutes after keynotes end, the lunch rush, the final session before happy hour.
The rapid response plan uses three escalation levels with specific triggers:
This diagram summarizes the three-level surge escalation workflow and the triggers that move you between levels.
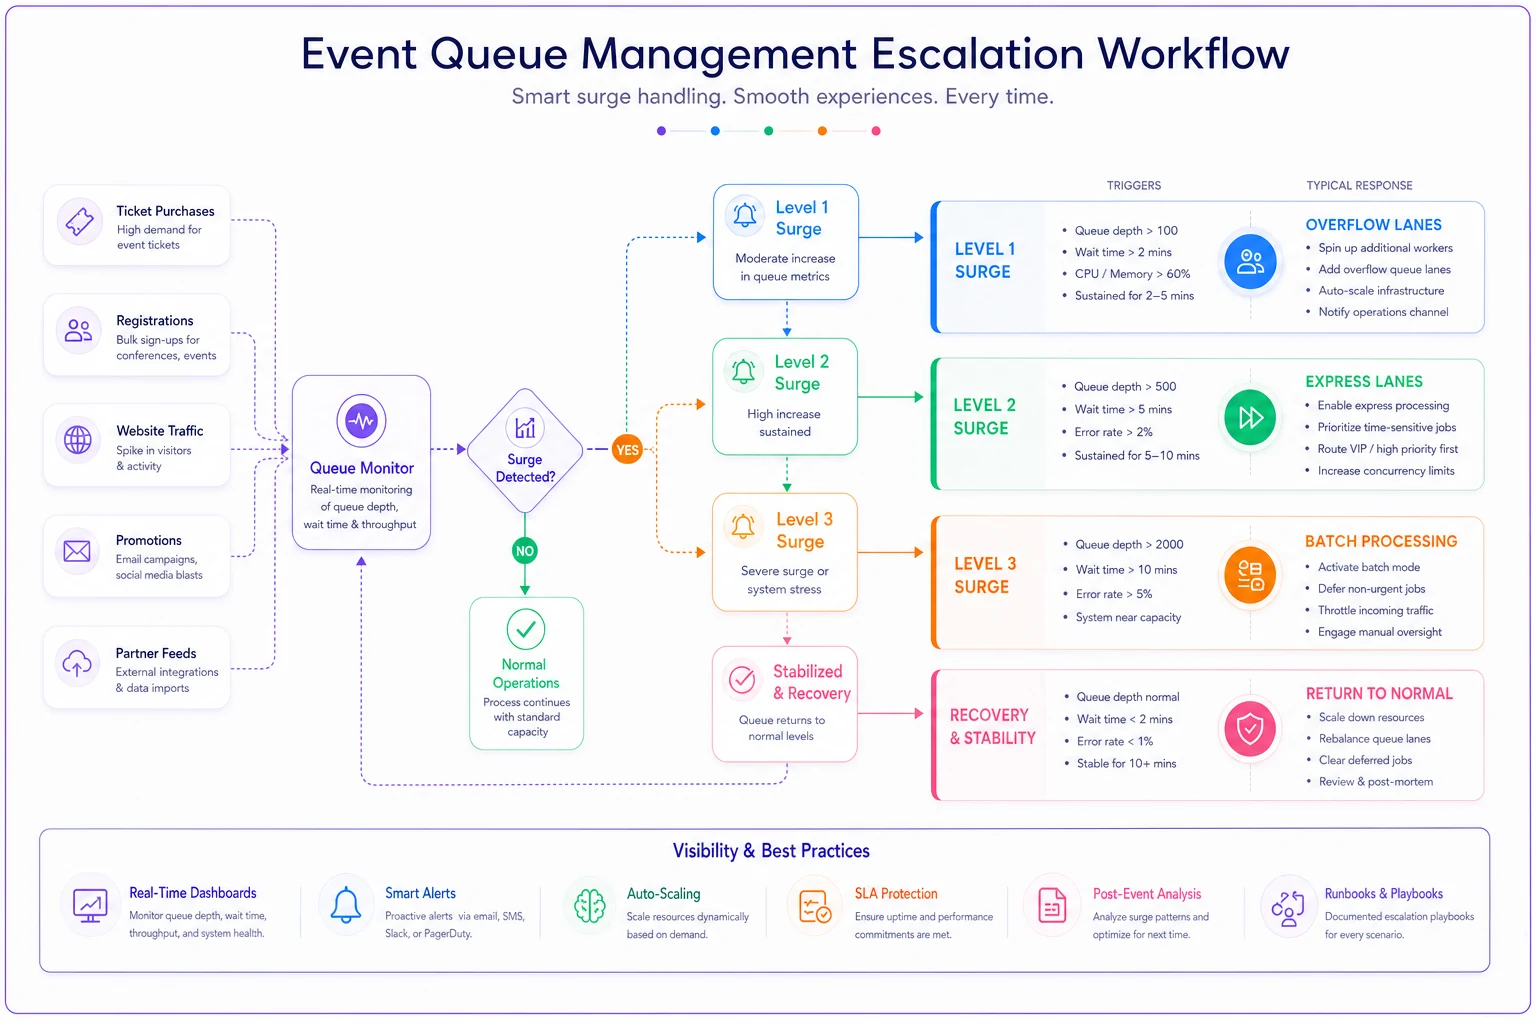
Level 1: Standard surge (1.5x normal flow) Triggers when queue depth exceeds 50 people or wait times hit 12 minutes. Response: Open pre-designated overflow lanes, deploy float staff to processing, activate digital notifications showing real-time wait estimates. This happens 3-5 times per day at most events.
Level 2: Peak surge (2.5x normal flow) Triggers at 100+ queue depth or 20-minute waits. Response: Convert adjacent spaces to queue overflow, implement express lanes for simple transactions, shift all available staff to processing roles, pause non-essential operations. Expect this 1-2 times per event, usually morning registration and lunch service.
Level 3: Critical surge (4x+ normal flow) Triggers when physical queue space reaches capacity or wait times exceed 30 minutes. Response: Implement batch processing (groups of 10-20 processed together), open emergency overflow areas, activate abbreviated processing protocols, deploy senior staff for crowd control. This might happen once per event, if at all.
Each level needs pre-printed action cards for staff. Not lengthy procedures — bullet points with specific actions. "Level 2 activated: Open stations 6-8, move Sarah to express lane, announce 20-minute wait on PA system."
The surge kit stays within 30 feet of main processing areas: extra iPads for mobile check-in, backup payment terminals, pre-counted cash boxes for making change, temporary signage for express lanes, emergency stanchions for overflow routing.
Quick Math Templates for Common Scenarios
Real calculations for standard event types, assuming realistic arrival distributions:
Corporate conference (500 attendees)
-
Morning registration
60% arrive between 7:30-8:30am = 300 people/hour
-
Processing time
90 seconds average with pre-registration
-
Stations needed
(300/60 × 1.5) / 10-minute wait = 3 stations
-
Queue space required
300 × 8 sq ft × 0.6 (not all queue at once) = 1,440 sq ft
-
Staff needed
3 processors + 2 flow controllers + 1 float = 6 total
Multi-day festival (5,000 daily attendance)
-
Gate entry
2,000 arrive first 2 hours = 1,000/hour peak
-
Processing time
45 seconds for ticket scan and security
-
Stations needed
(1,000/60 × 0.75) / 8-minute wait = 4 entry lanes
-
Queue space required
500 × 9 sq ft (outdoor spacing) = 4,500 sq ft
-
Staff needed
8 processors (2 per lane) + 4 flow controllers + 3 floats = 15 total
Trade show (2,000 attendees over 3 days)
-
Day 1 registration
50% on first day, 40% in first 2 hours = 400/hour
-
Processing time
2 minutes for badge printing and materials
-
Stations needed
(400/60 × 2) / 12-minute wait = 3 stations
-
Queue space required
200 × 8 sq ft × 0.8 utilization = 1,280 sq ft
-
Staff needed
3 processors + 1 flow controller + 1 float = 5 total
| Scenario | Stations needed | Queue space required | Staff needed |
|---|---|---|---|
| Corporate conference (500 attendees) | 3 stations | 1,440 sq ft | 3 processors + 2 flow controllers + 1 float = 6 total |
| Multi-day festival (5,000 daily attendance) | 4 entry lanes | 4,500 sq ft | 8 processors (2 per lane) + 4 flow controllers + 3 floats = 15 total |
| Trade show (2,000 attendees over 3 days) | 3 stations | 1,280 sq ft | 3 processors + 1 flow controller + 1 float = 5 total |
The adjustment factors matter: Add 20% more space for winter events (coats/bags), reduce processing time 15% for tech-savvy audiences, increase by 25% for events requiring document verification.
Technology Integration Without Complexity
The instinct is to solve queue problems with apps and digital systems. But technology that requires attendee participation usually makes queues worse, not better. QR codes that don't scan, apps that won't load, WiFi that can't handle peak loads — each failure adds 30+ seconds per person to processing time.
Passive flow monitoring through overhead cameras (not facial recognition, just blob detection) tracks queue depth and movement velocity. When flow drops below 2 feet per minute, the system alerts supervisors about potential bottlenecks. This runs entirely backend with no attendee involvement.
Dynamic display boards showing estimated wait times at 3-4 points throughout the venue. Not apps people need to download — physical displays they can glance at while walking by. Updates every 60 seconds based on current processing rate.
Staff-side queue management tools that let float staff mark their current assignment, track station processing times, and receive surge alerts. The operational intelligence stays with staff, not attendees.
AI-powered systems can predict surge timing based on session schedules, historical patterns, and real-time movement data. But the predictions only matter if operations can respond. A 15-minute warning about an incoming surge means nothing without pre-positioned staff and ready overflow areas.
Integration with volunteer scheduling systems becomes critical. Knowing you'll need 6 extra queue staff at 11:45am requires having those volunteers already on-site and available, not scrambling to find bodies when the surge hits.
When Queue Planning Actually Prevents Revenue Loss
Bad queues don't just frustrate attendees — they directly impact revenue through multiple channels most planners never track.
Merchandise sales drop 40% when queue wait times exceed 10 minutes. That limited-edition conference hoodie might seem worth a 5-minute wait, but at 15 minutes, most attendees walk away. For a mid-size conference selling $30k in merchandise, poor queue management easily costs $8-12k in lost sales.
Food and beverage suffers worse. Attendees skip purchasing entirely when faced with long lines, choosing to leave venues for outside options. Convention centers typically take 30-35% of F&B revenue. When attendees buy lunch elsewhere because of 25-minute queue waits, the venue notices — and charges penalties or restricts future booking access.
Session attendance patterns shift when registration queues run long. Late arrivals to opening sessions mean half-empty rooms for the first 20 minutes — exactly when speakers set context and energy. Sponsors paying $15k for speaking slots notice empty seats and don't renew.
Someone who spent 45 minutes in registration might attend this year, but they remember that experience when next year's invitation arrives. Poor queue experiences show up as 10-15% higher no-show rates for returning events.
The Compound Effect of Queue Failures
A registration backup at 8am doesn't just affect the morning — it cascades through the entire event. Late starts mean compressed networking breaks. Compressed breaks mean longer food service queues. Longer lunch queues mean afternoon sessions start late. Late sessions mean evening events push back. Pushed evening events mean overtime charges and vendor penalties.
One venue in Chicago documents this pattern so precisely they can predict total event delays based on morning queue length. Every minute of registration delay typically creates 2.8 minutes of total schedule slippage by day's end.
Queue controllers dealing with angry attendees for 2 hours straight make more errors, process slower, and need more frequent breaks. Processing speed drops roughly 20% after the first hour of continuous complaints. The same staff working smooth queues maintain consistent speeds for 3-4 hour shifts.
Building Your Queue Response Framework
Start with the physics, not the feelings. Measure your actual event spaces, calculate realistic densities, then add 30% buffer space. Most venues overstate their square footage by including unusable areas like columns, planters, and fire lanes.
Build your signage library before you need it. Generic arrow signs, lane markers, and basic instruction boards work across multiple events. The specific event details go on smaller, cheaper inserts that slot into the permanent frames.
Staff for surges, not averages. Your queue team should feel slightly overstaffed during normal flow because when surges hit, you need immediate response capacity. The cost of 2 extra float staff for 8 hours runs around $400-600. The cost of losing control of queues can hit thousands in overtime, penalties, and lost revenue.
Document everything in real-time. Queue depth at 15-minute intervals, processing times by station, surge response effectiveness. This becomes your baseline for improving next time. Most events run on gut feel and memory, which explains why they repeat the same queue disasters year after year.
Modern event queue management isn't about forcing people through lines faster — it's about understanding the operational geometry of crowd dynamics and building systems that adapt to natural flow patterns. When planners stop treating queues as necessary evils and start approaching them as solvable physics problems, the entire event experience transforms.
The math isn't complicated once you have the right formulas. The signage isn't expensive when you build it modularly. The staffing isn't overwhelming when you plan for surges instead of reacting to them. And the technology doesn't need to be complex when it focuses on operational intelligence instead of attendee apps.
What kills most events isn't bad programming or boring speakers — it's the 35 minutes attendees spend in poorly managed queues, slowly building resentment that colors their entire experience. Get the queue management right, and everything else becomes remarkably easier to execute.
Ready to elevate your event management?
Join 5,000+ event organizers using Festoly to save time, improve coordination, and deliver memorable experiences.