
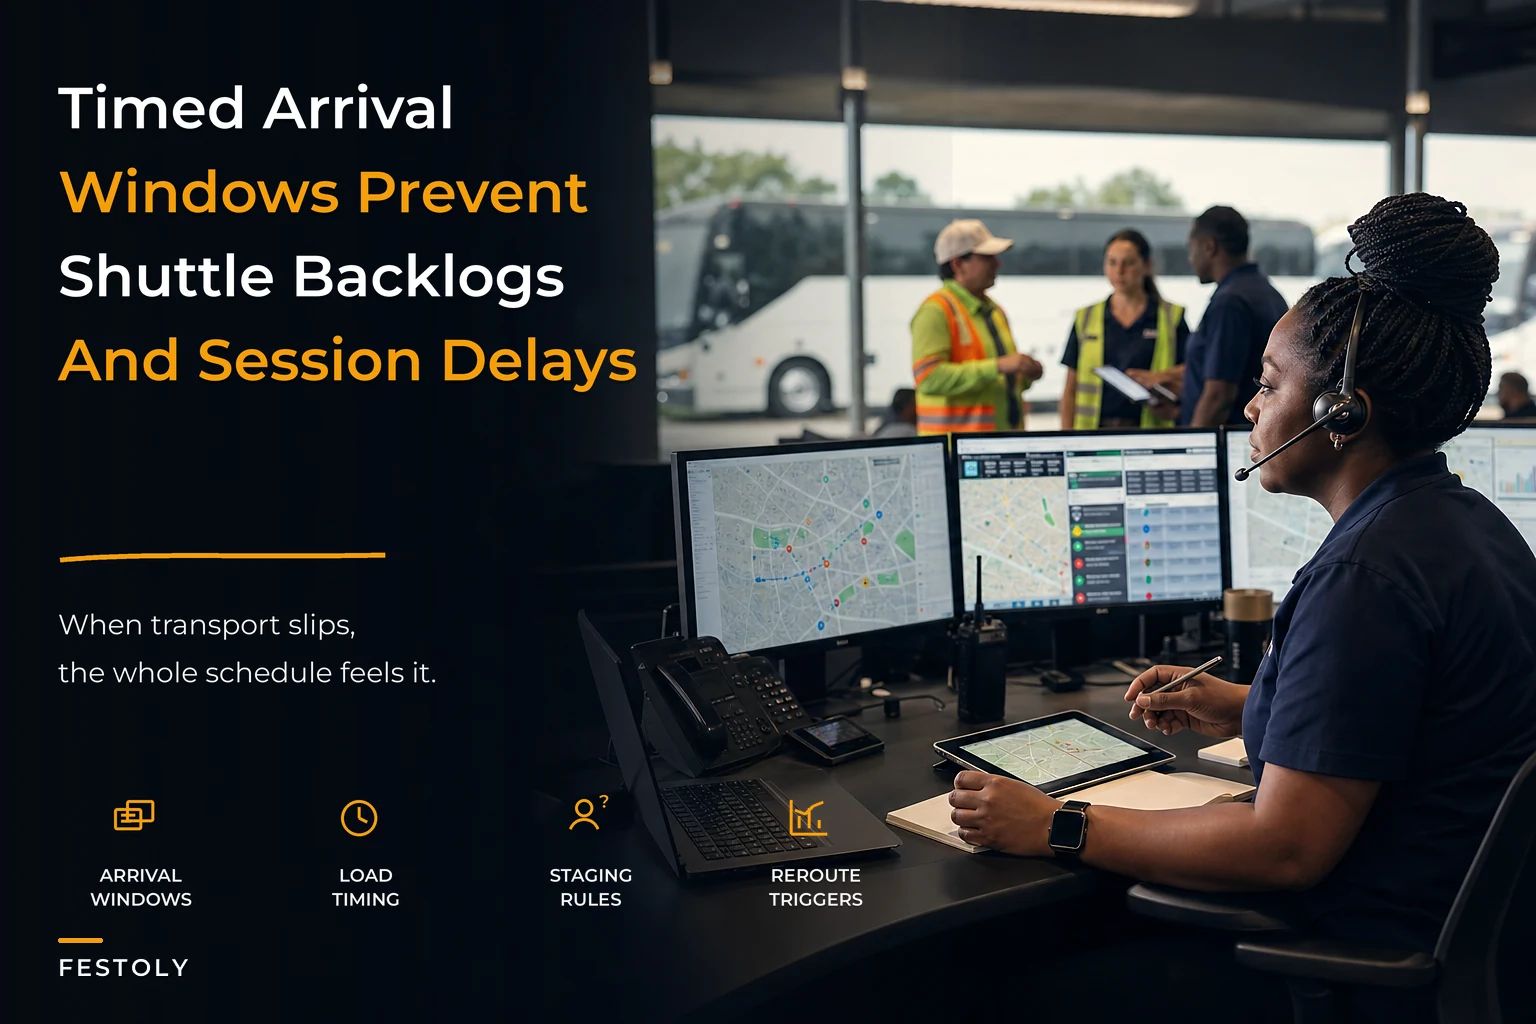

Most transport plans fail for the same reason: they treat arrival as one big surge instead of a series of predictable waves tied to what's actually happening inside the venue. A conference with a 9:00 keynote doesn't have a "morning rush." It has a spike between 8:15 and 8:50 driven entirely by one session, followed by a dead zone, followed by another spike when the afternoon breakouts start. When your shuttle and parking plan ignores the session grid, you get 40-minute queues at the curb while three empty buses sit staged half a mile away.
The organizers who get this right don't have more buses. They have a tighter link between the program schedule and the movement plan. Every shuttle dispatch, every parking lot opening, every signage change is triggered by demand they forecasted from the sessions themselves. That's the whole game, and it's what separates a transport operation that scales from one that collapses the moment attendance crosses a few thousand.
Why transport plans break away from the schedule
The typical planning mistake is building the transport plan and the program schedule in two separate documents, owned by two separate people, that only meet during a walkthrough the week before. Transport gets a headcount and a start time. Nobody hands them the session-by-session load curve, so they plan for an average that never actually occurs.
Here's what that looks like in practice. A regional trade show expects around 6,000 attendees across a day. The transport lead sizes shuttles for "6,000 people over 10 hours," which sounds like 600 per hour and feels manageable. But 55–60% of those people arrive in the 90 minutes before the opening general session. That's roughly 3,400 people compressed into an hour and a half, and the plan that looked fine on paper now needs nearly triple the throughput it was built for during the only window that matters.
The pattern repeats on the outbound side. Everyone assumes departure is gradual. It isn't. When the closing session ends, you get a wall of people hitting the shuttle lanes and parking exits within 20 minutes. If you sized your outbound based on inbound rates, you're already underwater.
Transport demand isn't a headcount. It's a curve, and that curve is drawn by your session schedule. Until the program grid and the movement plan live in the same operational picture, you're guessing.
Building the demand forecast from sessions, not headcount
Start with the schedule and work backward. Every session that draws a crowd creates an arrival window before it and a departure window after it. Your job is to translate the program into a demand curve for each transport mode.
Eliminate event chaos with Festoly.
Manage every aspect of your event seamlessly — from planning to execution.
- Centralized event scheduling
- Real-time attendee tracking
- Vendor & resource coordination
No credit card required
A workable forecast has a few inputs per session block:
-
Expected attendance for the session or block (not total registration — the actual draw)
-
Mode split — what percentage arrive by shuttle, personal vehicle, rideshare, or walk-in from nearby hotels
-
Arrival spread — how tightly people cluster before the start (keynotes cluster tight, casual expo hours spread wide)
-
Turnaround time for each shuttle loop, including load and unload
Once you have those, the math gets useful. Say a keynote draws about 4,000 people, 45% arrive by shuttle, and 80% of shuttle riders show up in the 45 minutes before doors. That's roughly 1,440 people needing shuttle capacity in 45 minutes. If your loop runs 22 minutes round-trip and each bus holds 50, one bus clears about 2 loops in that window — around 100 people. You need somewhere around 14–15 buses cycling to hold that curve, plus a couple staged as buffer. Miss that number and the queue snowballs fast. A queue that forms during a spike doesn't clear until well after the spike ends.
The forecast isn't a one-time calculation either. Multi-day events shift day to day — day one is heavy on arrivals from the airport and hotels, the final day front-loads departures. Rebuild the curve per day, per major session block, not set once and forgotten.
Timed arrival windows: spreading the curve instead of fighting it
You can't always add capacity, but you can flatten the demand curve. Timed arrival windows assign attendees a recommended arrival slot, usually tied to their session track or badge type. VIPs and speakers get the earliest window, general admission gets staggered slots across a 90-minute band before the opening.
The trick is making the windows feel like a benefit, not a restriction. Nobody follows an arrival slot because you told them to. They follow it when the early window comes with a shorter security line, a reserved shuttle, or coffee that's actually still hot. Tie the incentive to something real and compliance jumps.
A realistic split for a large conference opening might look like this:
| Arrival Window | Audience Segment | Target Volume | Incentive |
|---|---|---|---|
| 7:15–7:45 | Speakers, sponsors, VIP badges | ~600 | Express entry, reserved parking |
| 7:45–8:15 | Premium / early-bird ticket | ~1,200 | Priority shuttle, breakfast |
| 8:15–8:45 | General admission A–M | ~1,600 | Standard |
| 8:45–9:00 | General admission N–Z | ~1,400 | Standard |
Even imperfect compliance helps. If you shift even a third of your crowd out of the peak 30 minutes, you've cut the surge your shuttles and parking have to absorb by a meaningful margin — often enough to avoid adding vehicles at all.
The failure mode here is over-engineering. If you create eight narrow windows nobody understands, people ignore all of them and you're back to a single surge. Three or four clear bands beat eight precise ones every time.
Shuttle staging manifests: where most operations quietly fall apart
Staging is the part planners consistently underinvest in. A shuttle staging manifest isn't a bus schedule — it's a live document that says which vehicle is where, what it's doing, and what it does next, tied to the session clock.
The core problem staging solves is dead time. Buses that finish a loop and idle without a next assignment are wasted capacity during the exact window you can't afford waste. A good manifest assigns every vehicle a rotation: loop A during the morning spike, reposition to the hotel corridor for the mid-morning lull, back to the main lot before the lunch session ends.
A staging manifest should capture, per vehicle:
-
Vehicle ID and capacity
-
Current route assignment and next assignment with trigger time
-
Staging location when idle (and it should almost never be idle during a spike)
-
Driver contact and shift boundaries
-
A fallback role if pulled off primary route
The coordination challenge grows fast with scale. Managing 6 shuttles off a printed sheet is annoying but survivable. Managing 20 across three routes with drivers on different shift clocks and a live schedule that slips 15 minutes is where paper falls apart completely. This is the same coordination logic that governs queue geometry and surge response — a shuttle queue is just a moving version of the same throughput math, and staging is how you keep the input rate from overwhelming the curb.
The most common staging mistake: parking reserve buses close to the loading zone "so they're ready." That clogs the very lane you need for active loading. Stage the reserve fleet one holding area back, out of the flow, and pull them forward only on a trigger.
Parking manifests and the lot-by-lot fill logic
Parking is transport too, and it fails in a specific way: lots fill in the wrong order. If your closest lot fills first because it's the one everyone finds, your late arrivals get pushed to overflow lots with no shuttle connection — and now you've created a second transport problem inside your parking problem.
A parking manifest maps capacity to demand across the day. It answers: which lot opens when, which fills first by design, when overflow activates, and how each lot connects back to the venue. The logic should be deliberate — fill the lots with the worst walk or the longest internal shuttle first, while attendees are patient and early, and save the close-in convenient lots for the late rush when tempers are shorter.
A typical example: an event with three lots totaling around 2,800 spaces. Lot C (farthest, 1,000 spaces, connected by a short shuttle loop) opens first and gets directed all early arrivals. Lot B (900 spaces) opens as C crosses 70%. Lot A (900 spaces, closest, walkable) is held for the final arrival window and accessibility needs. Reverse that order and your close lot fills by 8:00, your farthest lot fills last during the worst crush, and your shuttle demand spikes at exactly the wrong moment.
Parking also feeds directly back into shuttle demand. Every car in a far lot with a shuttle connection is shuttle load you have to plan for. The parking manifest and the shuttle manifest aren't separate documents — the fill order of your lots is a direct input to your shuttle curve.
Dynamic signage tied to real conditions
Static signage assumes the plan holds. It never fully does. When Lot C hits capacity, every sign pointing to Lot C is now actively working against you, sending cars into a full lot to turn around and clog the approach road.
Dynamic signage — even simple digital boards or staffed sign points with swappable messaging — lets you redirect flow the moment a lot fills or a route backs up. The signage plan should be written as a set of states, not a single layout:
-
State 1 (early) All approach signage directs to Lot C.
-
State 2 (Lot C at 70%) Approach signage splits traffic, adds Lot B.
-
State 3 (Lot C full) Lot C signage flips to "FULL — proceed to Lot B," approach signs drop Lot C entirely.
-
State 4 (late window) Lot A opens, VIP and accessibility routing activates.
-
State 5 (outbound) Every sign reverses to exit routing before the closing session ends.
The mistake is treating signage as a setup task instead of an operational one. Signs need an owner during the event — someone watching the fill data and flipping states on trigger. A sign that says the wrong thing is worse than no sign, because people trust it and act on it at the exact moment you need them to do the opposite.
Contingency rerouting when the schedule slips
Sessions run long. Keynotes start late. A fire alarm empties a hall 40 minutes early. The moment reality diverges from the schedule, your entire demand curve shifts, and a transport plan built on the original grid is now wrong.
Contingency rerouting is about pre-deciding your responses so you're not improvising during a crush. The triggers that should have a pre-built response include:
-
Session ends early or late — outbound shuttle surge shifts, reserve fleet activates or holds
-
A lot fills faster than forecast — signage state advances, overflow opens ahead of schedule
-
A route backs up — reroute that loop, pull a reserve bus to a secondary path
-
Weather event — covered loading priority, shortened loops, more frequent smaller runs
Here's a concise workflow showing triggers mapped to named actions and owners for quick execution.
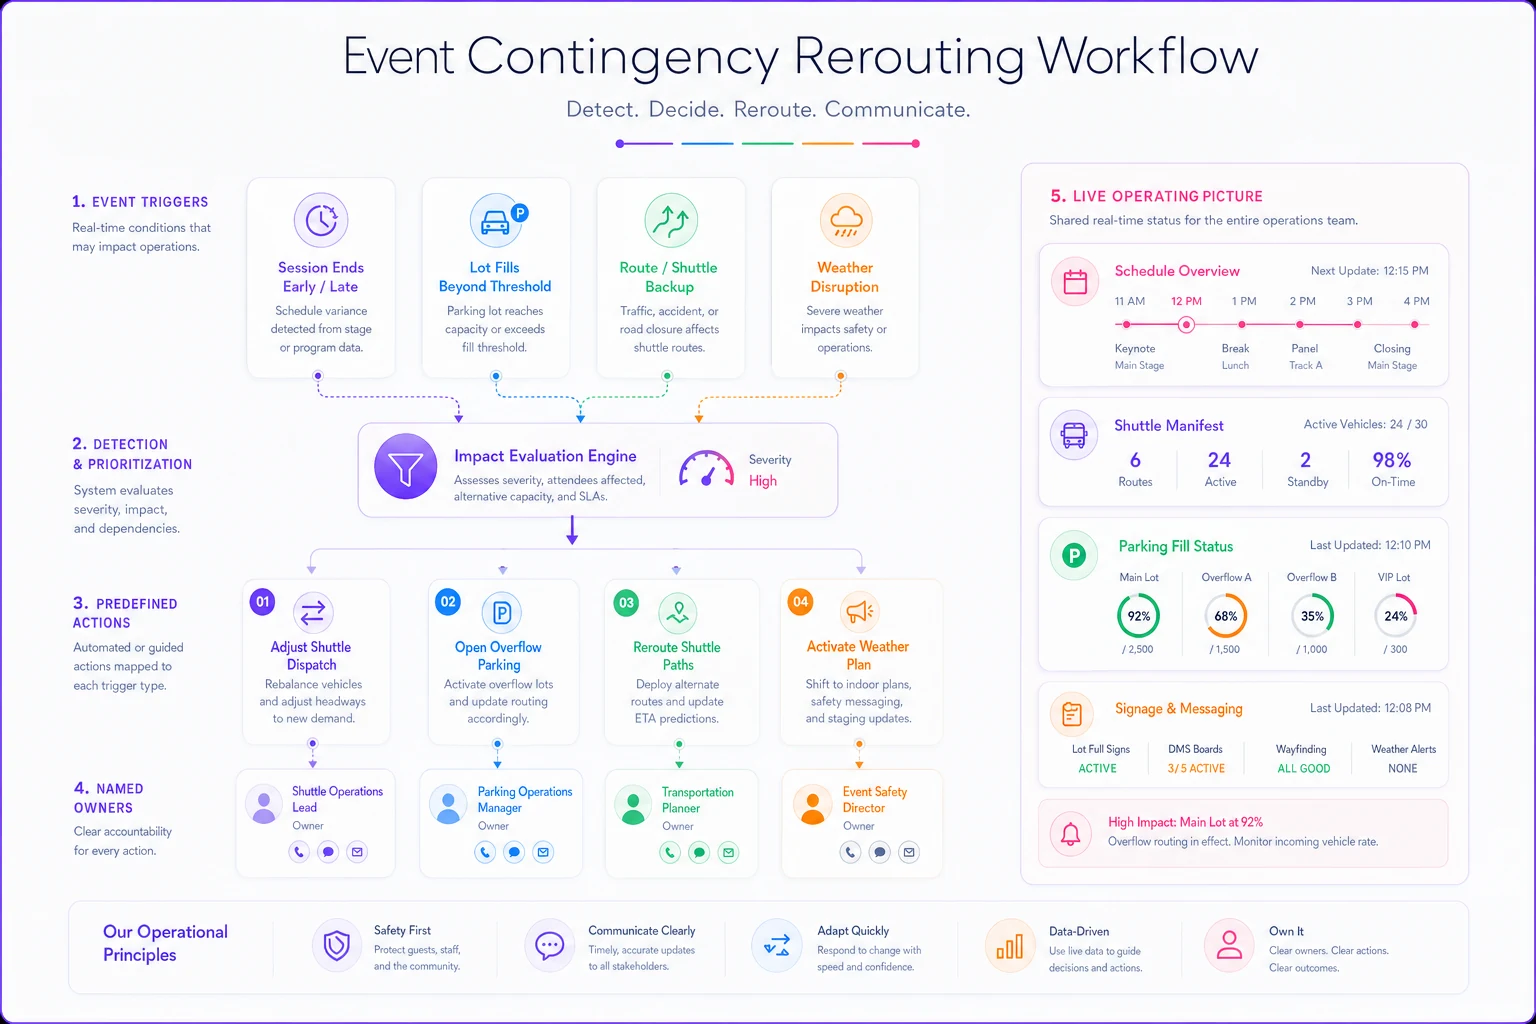
Each of these should map to a named action and a named owner. The link between the program and the movement plan matters most here — a show-caller who knows the keynote is running 12 minutes long should be able to signal transport before the doors open, not after 4,000 people hit the curb. This is the same milestone-and-trigger discipline that keeps exhibitor operations aligned to contract and on-site rules: the plan works when every phase has a defined trigger and someone accountable for pulling it.
The teams that reroute well share one habit — they run the transport operation off a single live picture. Not the transport lead's picture and the program manager's separate picture. One shared operating view where a schedule slip visibly moves the demand curve, and everyone with a role sees the same change at the same moment. This is where lightweight operational software earns its keep: keeping the session schedule, the shuttle manifest, the parking fill status, and the signage states in one place so a change in one automatically flags the others, instead of relying on someone remembering to radio it around.
When a full demand-driven system makes sense — and when it's overkill
Not every event needs this level of structure. If you're running a few hundred people at a single venue with on-site parking, a demand curve and staging manifest are more overhead than value. A simple headcount plan is fine.
The system earns its place when a few conditions stack up:
-
Attendance above roughly 2,000–3,000 where surges become genuinely hard to absorb
-
Multiple transport modes — shuttles plus parking plus rideshare plus hotel corridors
-
A session schedule with clear draw sessions creating real spikes
-
Multiple lots or off-site parking requiring fill logic and connections
-
Any event where a 30-minute curb delay damages the experience — high-ticket conferences, sponsor-heavy shows
Who should not build this: single-venue local events, walk-heavy urban events where most people arrive on foot or transit, and anything where the venue controls transport for you. Forcing a demand-driven playbook onto those just adds coordination cost with no throughput gain.
A real scenario
A two-day regional professional conference, around 5,500 attendees, ran into a curb problem on day one of its prior year: shuttle queues hit 35–40 minutes during the morning spike, and the closest parking lot filled by 8:00, pushing latecomers into an overflow lot with no shuttle and a 12-minute walk. Complaints clustered entirely around arrival.
The following year they rebuilt around the session schedule. They forecast the morning curve off the opening general session, added three staggered arrival windows tied to badge tiers, reversed their lot fill order so the far shuttle-connected lot filled first, and put two staff on dynamic sign points who flipped routing states as lots crossed thresholds. Staging moved the reserve buses one holding area back so the loading lane stayed clear.
Peak shuttle wait dropped to somewhere around 12–15 minutes. The closest lot stayed open into the late arrival window because it was intentionally held. They didn't add a single bus — same fleet, better sequencing. The arrival complaints that dominated the prior year's survey mostly disappeared, and the operations team spent the morning managing triggers instead of firefighting a queue.
That result isn't exceptional. It's what happens when the pieces are actually connected.
Bringing it together
Event transport operations works when it stops being a standalone logistics task and becomes an extension of the program schedule. The session grid draws the demand curve. The demand curve sizes the shuttles and sequences the lots. Staging keeps capacity moving instead of idling. Signage and rerouting keep the plan honest when reality drifts, which it always does.
The events that move people well aren't the ones with the biggest fleets. They're the ones where the schedule, the manifests, the parking logic, and the signage all read from the same picture — and where every change in one triggers a change in the rest. Build that connective tissue and a crowd of several thousand moves in waves you planned for, instead of a surge you're always one step behind.
The events that move people well aren't the ones with the biggest fleets. They're the ones where the schedule, the manifests, the parking logic, and the signage all read from the same picture — and where every change in one triggers a change in the rest. Build that connective tissue and a crowd of several thousand moves in waves you planned for, instead of a surge you're always one step behind.
Ready to elevate your event management?
Join 5,000+ event organizers using Festoly to save time, improve coordination, and deliver memorable experiences.