

The CFO wants to know why sponsorship revenue is down 18% from projections. Marketing says registration conversion looks healthy at 42%. Operations counted 3,847 attendees on-site. Finance shows 3,621 paid registrations. The registration platform reports 4,102 total signups.
This kind of disconnect isn't unusual—it's basically the default state for most event organizations running without any real data governance structure. And it gets worse when you realize each department treats their number as gospel while quietly assuming everyone else's figures are wrong.
The metric ownership vacuum
Most event teams operate on an unspoken assumption: whoever touches the data owns it. Registration owns attendee counts. Finance owns revenue. Marketing owns conversion rates. Operations owns capacity numbers.
That distributed ownership creates three problems that quietly corrupt your analytics.
Nobody reconciles differences between systems. When Eventbrite shows 1,200 registrations and your CRM shows 1,147, both teams just use their own number. The 53-person gap becomes a permanent mystery that shows up in every post-event report, and over time it erodes confidence in all your metrics—not just that one.
Metric definitions drift between departments. Marketing counts "registered attendees" as anyone who completed the form. Finance only counts paid registrations. Operations counts badges printed. Three definitions, three numbers, zero alignment on what "attendance" actually means.
When something breaks, nobody owns it. Your sponsor satisfaction score drops from 8.2 to 6.4 between events, but since three departments touch sponsor data, everyone assumes someone else will dig into it. Usually nobody does.
Building your data contract framework
A data contract isn't a legal document. It's an operational agreement that defines who owns each metric, how it's calculated, and what happens when something breaks.
Eliminate event chaos with Festoly.
Manage every aspect of your event seamlessly — from planning to execution.
- Centralized event scheduling
- Real-time attendee tracking
- Vendor & resource coordination
No credit card required
Start with your core business metrics. For a conference, that might look like:
| Metric and owner |
|---|
| Total registrations (Marketing owns) |
| Paid registrations (Finance owns) |
| Check-in rate (Operations owns) |
| No-show rate (Operations owns) |
| Ticket revenue (Finance owns) |
| Sponsorship revenue (Partnerships owns) |
| Exhibitor revenue (Sales owns) |
| Merchandise revenue (Operations owns) |
| Session attendance (Content owns) |
| App engagement (Marketing owns) |
| Networking connections (Product owns) |
| Survey completion (Operations owns) |
For the ownership model to actually work, it needs three things.
The metric owner is the single source of truth for that number. They define the calculation, pick the data source, and resolve discrepancies. When registration numbers conflict between systems, Marketing's definition wins—because they own the metric.
The owner also maintains the calculation logic. That means documenting exactly how the metric is computed, which filters apply, and what edge cases exist. "Paid registrations" might exclude comps, press passes, and staff badges—but only the metric owner gets to set those rules.
Put the metric definition in a single accessible doc and link dashboards to it.
Ownership also means monitoring quality. When check-in rates suddenly spike to 97% (physically impossible for most events), Operations investigates because that number is theirs.
Your integration priority map
Not all data connections matter equally. Some directly affect revenue and operations. Others just feed dashboards nobody checks.
Map your integrations across two dimensions: business impact and implementation effort.
Critical integrations (high impact, implement first)
-
Registration platform → CRM
-
Payment processor → Financial system
-
Check-in system → Registration platform
-
Email platform → CRM
Important integrations (moderate impact, implement second)
-
Survey platform → CRM
-
Mobile app → Analytics platform
-
Badge printing → Check-in system
-
Session scanning → Attendee database
Nice-to-have integrations (low impact, implement if resources allow)
-
Social media → Analytics dashboard
-
WiFi analytics → Attendance tracking
-
Parking system → Capacity planning
-
Photo booth → Engagement metrics
The priority map keeps you from spending three weeks wiring up photo booth data while your registration and payment systems still don't talk to each other.
Most events try to integrate everything at once and end up with a fragile web that breaks constantly. Get your critical integrations bulletproof before adding more complexity.
Dashboard SLAs that actually matter
Your dashboards are only useful if the data arrives on time and accurately. Most events have no service level agreements for analytics at all, which leads to stale dashboards nobody trusts.
Define freshness requirements by data type:
Real-time data (updates every 5 minutes)
-
Current attendance count
-
Registration pace
-
Check-in status
-
Capacity warnings
Near-time data (updates every hour)
-
Session attendance
-
Revenue totals
-
Sponsor booth traffic
-
Survey responses
Daily data (updates overnight)
-
Demographic breakdowns
-
Geographic analysis
-
Historical comparisons
-
Trend analysis
Each SLA needs an escalation trigger. When real-time attendance data stops updating for 15 minutes, who gets the alert? When daily revenue reconciliation fails three days running, what actually happens?
Building on principles from our modular operations playbook, assign clear ownership for dashboard monitoring. The registration team might own attendance dashboards while finance owns revenue dashboards.
Your SLAs should also define accuracy thresholds. Real-time check-in counts might tolerate a 2% variance, while financial dashboards need to hit 100% accuracy after daily reconciliation. The difference matters—don't treat all data the same.
Quality gates throughout your event lifecycle
Data quality problems compound. A small error in early registration becomes a massive reconciliation project after the event wraps.
Install checkpoints at natural workflow transitions:
Pre-registration gates
-
Verify registration form captures required fields
-
Test data flow to CRM
-
Confirm tracking codes work
-
Validate payment processing connection
Active registration gates
-
Weekly duplicate detection
-
Payment reconciliation every Monday
-
Abandoned cart analysis
-
Email deliverability checks
Pre-event gates
-
Final attendee list reconciliation
-
Badge data verification
-
Check-in system testing
-
Mobile app data sync
On-site gates
-
Hourly check-in reconciliation
-
Daily financial settlement
-
Session attendance validation
-
Real-time capacity monitoring
Post-event gates
-
Complete attendee reconciliation
-
Final revenue accounting
-
Survey response validation
-
Sponsor metrics delivery
These gates catch problems while they're still fixable. Finding 200 duplicate registrations two days before the event is annoying but manageable. Finding them at on-site check-in creates chaos.
Below is how data flows through these lifecycle stages and where governance checkpoints apply:
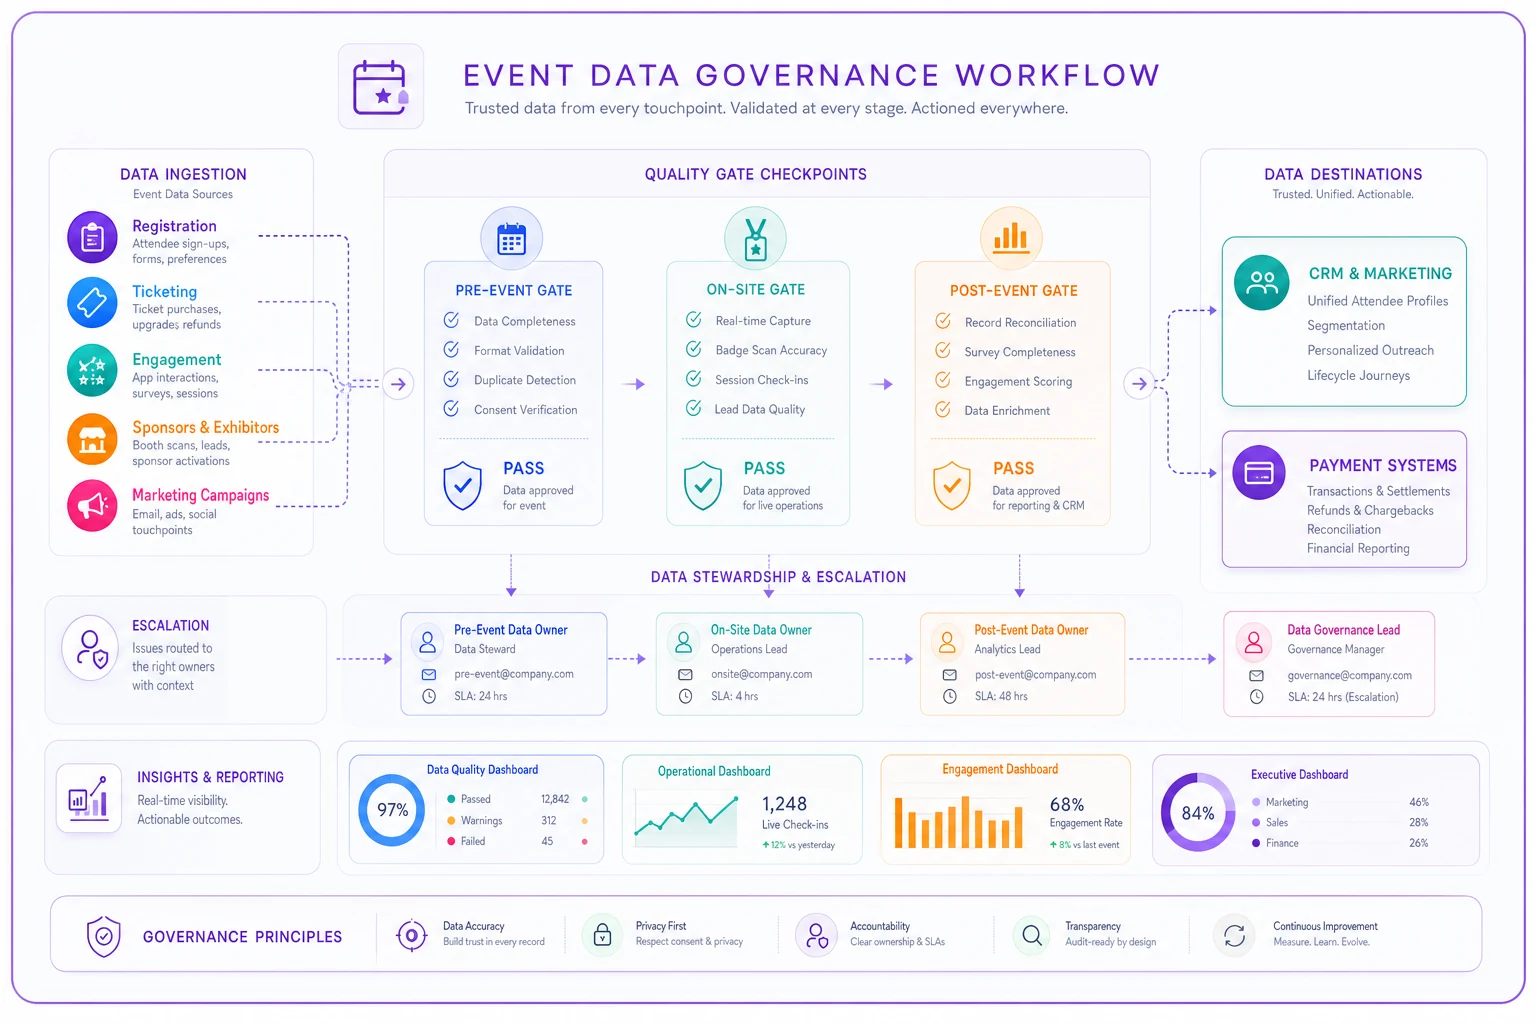
The diagram highlights checkpoints and escalation paths across the event lifecycle.
The routine hygiene that prevents data disasters
Most data catastrophes start small. A field mapping changes slightly. An integration quietly drops 3% of records. A calculation rounds differently. Nobody notices until the damage stacks up.
Build routine quality checks that run automatically:
Daily checks
-
Registration count matches between systems (±1%)
-
Payment totals reconcile
-
No duplicate primary records created
-
All critical integrations ran successfully
Weekly checks
-
Conversion funnel metrics trend normally
-
No fields show unusual null rates
-
Geographic data passes validation
-
Email bounce rates stay under threshold
Monthly checks
-
Historical comparisons remain consistent
-
Calculated metrics match manual verification
-
Data retention policies executed
-
Archive processes completed successfully
These checks need automated alerts, not manual review. When registration counts diverge by more than 50 people, the metric owner gets notified immediately—not at the next weekly meeting.
Building your operational data culture
The best governance framework fails if your team doesn't actually use it. You need habits that make good data practices automatic.
Start with one simple rule: every operational decision needs the relevant metric owner in the room. Planning session capacity? The person who owns attendance metrics joins that conversation. Setting sponsorship prices? The revenue metric owner participates.
Build data review rituals that stick. A 15-minute Monday check on weekend registration activity. A Thursday look at integration health before the weekend rush. A monthly deep-dive on metric quality. None of these need to be long—they just need to happen consistently.
Document your source of truth hierarchy. When systems conflict, which one wins? Usually it follows the money—your payment processor beats your registration platform for revenue data. Your check-in system beats your CRM for attendance counts.
Similar to how we approach ROI attribution, each metric needs clear attribution rules. When someone registers through a partner code but pays directly, which channel gets credit? The metric owner decides and documents it.
Common failure patterns in event data operations
The same problems keep coming up, mostly because teams focus on technology instead of governance.
The integration cascade failure
One system goes down and takes four connected systems with it. Your registration platform has an outage, which breaks check-in, which stops session tracking, which kills mobile app features.
Prevention requires integration independence. Each system should degrade gracefully when upstream data stops. Your check-in system maintains a local cache. Your mobile app shows last known good data. Session tracking collects locally and syncs when the connection returns.
The definition drift problem
"Registered attendees" slowly morphs across departments. Marketing adds pending registrations. Sales includes invited prospects. Operations subtracts no-shows. By year three, nobody agrees on what the number represents.
Lock definitions in your data contracts. Changes require sign-off from the metric owner and downstream consumers. Version your definitions so you can track when and why they changed.
The reconciliation debt spiral
Small discrepancies get ignored because they're "only off by a few dozen." These stack up over months until you're hundreds off with no idea where the gap originated. Forcing reconciliation at every quality gate stops this. A 10-person difference gets investigated immediately, not after it compounds to 100.
The technology foundation for sustainable governance
Data governance requires more than spreadsheets and good intentions. You need systems that enforce your governance model automatically rather than relying on people to remember.
Your operational software should embed governance into workflows. When someone creates a new registration type, the system notifies the metric owner. When an integration fails, alerts go to both the technical team and the metric owner—not just one or the other.
Modern platforms can monitor data quality continuously instead of waiting for someone to run a manual check. They detect when registration velocity drops unexpectedly, when conversion rates spike outside normal ranges, or when usually-correlated metrics suddenly diverge.
AI-powered operational software is particularly useful for anomaly detection across a complex data ecosystem. Instead of writing hundreds of manual checks, the system learns your normal patterns and flags deviations—catching the subtle problems that humans miss, like when registrations from one region stop converting, or when a specific ticket type starts showing unusual refund patterns.
The technology should also maintain your audit trail automatically. Every metric change, every definition update, every reconciliation adjustment gets logged with context. Six months later, you can see exactly why attendance numbers were adjusted and who approved it.
Starting your governance transformation
Don't try to govern all your data at once. Pick five critical metrics and build the model around those first.
For most events, start with:
-
Total registered attendees
-
Revenue (tickets + sponsorships)
-
Actual attendance (checked in)
-
Attendee satisfaction (NPS)
-
Cost per attendee
Assign owners, document definitions, create quality checks, and set SLAs for just these five. Run this for one full event cycle. The lessons will tell you how to expand.
Your governance model needs teeth to work. When quality gates fail, something must happen. When SLAs break, someone gets escalated to. When definitions drift, the metric owner has authority to correct them. Without consequences, the framework is just documentation nobody reads.
Moving beyond reactive analytics
Most events treat analytics as a post-event exercise. You run the event, then analyze what happened. Data governance turns analytics into an operational discipline that improves decisions in real time.
With proper governance in place, you know when registration patterns shift before it's too late to adjust. You catch revenue shortfalls while there's still room to respond. You spot operational problems before they cascade into something bigger.
The time saved on reconciliation alone tends to pay back the investment within two event cycles—then add the revenue protected by better monitoring and the decisions improved by data people actually trust.
Event data governance isn't about building perfect systems or eliminating every discrepancy. It's about creating enough structure that your team trusts the numbers, owns their metrics, and catches problems early. Start with ownership. Put a human name next to every metric that matters. Build from there.
Ready to elevate your event management?
Join 5,000+ event organizers using Festoly to save time, improve coordination, and deliver memorable experiences.