

Most crowd plans fall apart the same way. Not because someone forgot a control point, but because the plan lived in a binder three people had read, the density numbers were a gut feeling, and the moment things got tight nobody knew who was allowed to close a gate. The plan existed. The operating model didn't.
That distinction matters more than most people realize. A plan is a document. An operating model is the connective tissue between your density math, your monitoring, your steward roles, your escalation authority, and your rehearsals — and it's the thing that decides whether a busy corner becomes a photo or an incident. It's also the part that gets skipped, and the first thing that breaks.
Why the plan holds on paper but breaks in the field
Walk into most event control rooms and you'll find the same gap. The safety plan has beautiful capacity numbers. The staffing sheet has stewards assigned to zones. Radio channels are labeled. But three connections are missing, and those three gaps are where crowd management actually lives.
First, the density numbers aren't tied to a decision. Someone calculated that a plaza holds 2 people per square meter at "comfortable" and 4 at "crush risk," but nobody defined what happens between those numbers. A steward watching a filling area has data and no trigger.
Second, the steward rolebook is a job title, not a decision authority. "Zone lead" tells you where someone stands. It doesn't tell you whether that person can hold a gate, reroute a flow, or call for a pause without asking permission. In a surge, the time spent asking permission is exactly the time you don't have.
Third, escalation has no clock. "Notify the safety officer if concerned" isn't an escalation SLA. It's a hope. When you don't attach a time and a threshold to escalation, every judgment call routes through whoever is most cautious or most confident on shift, and neither of those is a system.
What comes up again and again across large-footprint events is that the failure is almost never a lack of resources. It's that density modeling, monitoring, roles, and escalation were designed by different people at different times and never wired into a single loop.
The five components, and why they only work together
A crowd management operating model has five parts. Individually they're common enough. The value is entirely in how they hand off to each other.
Eliminate event chaos with Festoly.
Manage every aspect of your event seamlessly — from planning to execution.
- Centralized event scheduling
- Real-time attendee tracking
- Vendor & resource coordination
No credit card required
-
Density modeling — the math that tells you how many bodies a space can hold at each risk level, per zone, not per venue.
-
Sensor and visual monitoring — the eyes that tell you where you actually are against that model, in near real time.
-
Steward and security rolebooks — the pre-assigned authority that says who acts, on what signal, without asking.
-
Escalation thresholds and SLAs — the ladder that defines what happens at each density band, and how fast.
-
Rehearsal cadences — the reps that make all of the above muscle memory instead of a document.
Each component is only as good as the handoff into the next one. Perfect density math is useless if monitoring can't tell you which zone you're in. Great monitoring is useless if the steward watching it can't act. And a steward with authority is a liability if nobody rehearsed what "act" means.
The operating model is the wiring, not the components.
Density modeling that produces triggers, not just capacity numbers
Most capacity work stops at a single number — the fire-code occupant load. That number is legally necessary and operationally almost useless, because crowds don't fill evenly. A festival ground rated for 15,000 can have a stage-front zone at genuine crush density while two-thirds of the site is half-empty.
Model at the zone level. Break the site into the choke points and gathering areas that actually matter: main stage front-of-house, entry funnels, the food court intersection, the bridge or ramp everyone uses between stages. For each zone, calculate area and set density bands.
A workable band structure looks like this:
| Density (people/m²) | State | What it means operationally |
|---|---|---|
| Under 2 | Free flow | Normal circulation, no action |
| 2 – 3 | Busy | Monitor closely, stewards visible and spacing |
| 3 – 4 | Constrained | Begin metering inflow, ready reroute options |
| 4 – 5 | Critical | Active flow control, escalation clock running |
| Over 5 | Danger | Hold, pause, or evacuate the zone |
The number that matters most isn't the danger threshold — it's the constrained band. That's your intervention window. If the model doesn't define what to do at 3 people/m², all your control happens at 5, which is far too late. Density lags perception. By the time it feels dangerous, you're already inside the number.
A common mistake: modeling static density and ignoring flow. A zone at 3 people/m² that's still filling is a very different situation than the same zone draining. Your model needs a rate-of-change assumption, even a rough one. "Constrained and rising" is an action state. "Constrained and stable" can be watched.
Monitoring: turning the model into a live position
The model tells you the map. Monitoring tells you where you are on it. The gap between the two is where most control rooms lose the plot.
There are three monitoring layers, and mature operations run all three:
-
Sensor data — entry/exit counters, Wi-Fi or camera-based density estimation, turnstile counts. Good for trend and total, weaker on specific hot spots.
-
Visual/CCTV — a spotter watching feeds against the zone map. Slower to quantify but far better at catching the thing sensors miss: a stalled group, a barrier failure, a crowd beginning to sway.
-
Ground reports — stewards radioing what cameras can't see. The most underrated layer, because a steward standing in a zone feels pressure and mood a camera doesn't register.
The operational failure usually isn't missing data. It's conflicting data with no rule for which source wins. Sensors say 3.2, the spotter thinks it looks worse, the ground steward says people are getting agitated. Who's right?
A quick visual of how these layers feed decisions and escalate can make alignment easier.
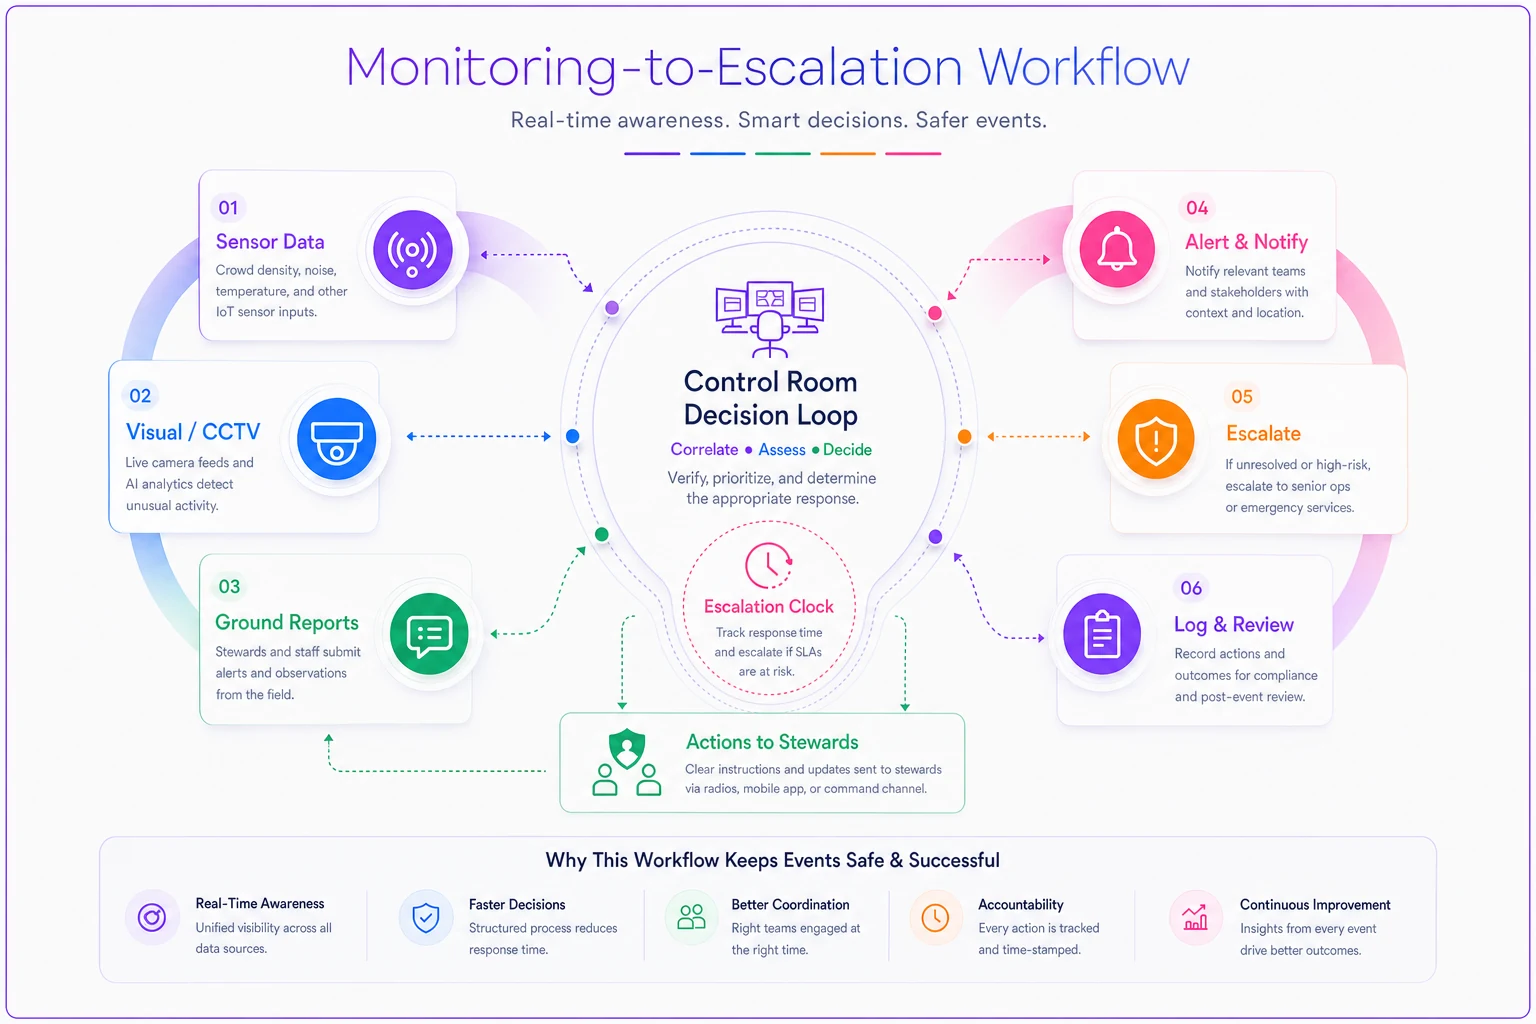
The rule that works: ground reports escalate faster than sensor data. If a steward in the zone says it feels critical, treat it as critical while you verify — don't wait for the counter to catch up. Sensors are for trend and confirmation. Human judgment on the ground is your early warning, and it should be allowed to trip the escalation clock on its own.
This connects directly to your broader risk taxonomy — how you classify and prioritize threats. If you haven't built that layer, the Event Risk & Resilience Framework covers how to structure triggers and mitigation playbooks so crowd density sits inside a wider system instead of being managed in isolation.
Steward rolebooks: authority, not just position
A rolebook that lists where stewards stand is a staffing chart. A rolebook that defines what each role can decide without asking is an operating model.
Every steward and security role needs three things written down:
-
Trigger — the signal they act on ("zone reaches constrained band, or I judge it constrained-and-rising")
-
Authority — what they can do without approval ("meter inflow, reposition barriers, request a hold from zone lead")
-
Boundary — what they cannot do alone ("cannot pause the stage, cannot initiate evacuation")
The pattern that causes real problems: giving everyone the same authority, or giving nobody any. If every steward can call a hold, you get chaos and false stops. If nobody can act without the safety officer, that officer becomes the bottleneck the moment two zones go constrained at once — and two zones going constrained simultaneously is exactly the scenario your model is supposed to survive.
The fix is layered authority mapped to density bands. Front-line stewards own the busy and constrained responses in their zone — metering, spacing, visibility, small reroutes. Zone leads own critical — holds, larger reroutes, and starting the escalation clock upward. The safety officer owns danger — pause, evacuate, emergency services. Each layer acts within its band without waiting on the layer above.
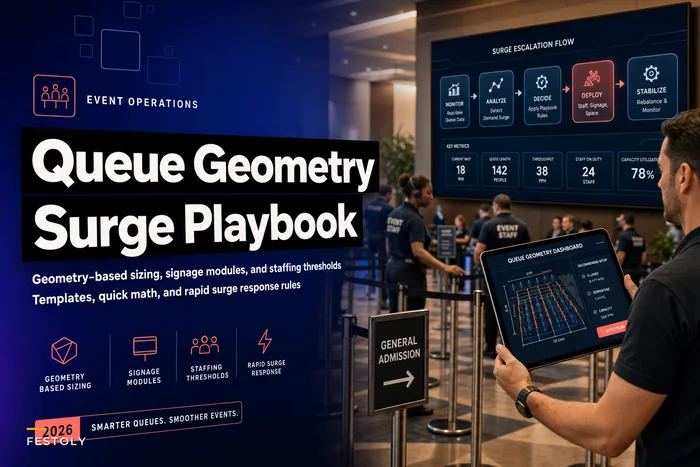
This is the same logic that governs queue flow control — deciding who can open a lane, hold a line, or trigger a surge response. The queue management approach to geometry-based sizing and surge rules pairs naturally here, because queues are where controlled density becomes uncontrolled density if nobody owns the response.
Escalation SLAs: attaching a clock to the ladder
Escalation without time is a suggestion. The SLA is what makes it a system: at each density band, this happens, within this many minutes, or it moves up a level automatically.
A concrete escalation ladder for a single zone:
-
Busy (2–3) Zone stewards increase visibility and spacing. Logged, no time pressure.
-
Constrained (3–4) Zone lead notified within 60 seconds of the trigger. Inflow metering begins. Reroute options confirmed ready.
-
Constrained and rising Safety officer notified within 2 minutes. If density doesn't stabilize within 5 minutes, auto-escalate to critical response regardless of the reading.
-
Critical (4–5) Active flow control. Safety officer takes zone command. Adjacent zones alerted to absorb rerouted flow. Emergency services on standby.
-
Danger (5+) Immediate hold or evacuation of the zone. No further deliberation — the decision was pre-made at model time.
The most important line in that ladder is the auto-escalation in step three. Without it, a zone sits in "constrained, someone's watching it" limbo for far too long, because whoever is watching keeps hoping it'll ease. The clock removes hope from the decision. If it hasn't improved in the defined window, it moves up whether or not anyone feels ready for that.
One thing planners consistently get wrong: they write the escalation ladder for the main stage and forget the transition zones — bridges, ramps, and corridors between attractions. Those are frequently the real crush points, because they combine two flows and have fixed width. Every zone in your model needs its own SLA, and the transition zones need them most.
Rehearsal cadence: the part that decides whether any of this works
You can wire density, monitoring, roles, and escalation together perfectly on paper and still fail on the day, because the first time your team runs the loop under pressure cannot be the real event. Rehearsal is what converts the document into reflex.
Drill the slow, constrained-band creep as a routine scenario, not just the dramatic evacuations.
The failure pattern is predictable: teams rehearse the dramatic scenarios — the full evacuation, the medical emergency — and skip the boring one, which is the slow constrained-band creep that's actually how most crowd incidents build. Nobody drills "the plaza has been at 3.5 and rising for four minutes" because it doesn't feel like an emergency. That's exactly why it should be drilled.
-
Planning phase (weeks out) Tabletop the density model. Walk each zone's bands and escalation ladder with the leads. Argue about the thresholds now, not on show day.
-
Day before Live walk-through on site. Stewards stand in their zones, practice metering and rerouting physically, confirm sightlines and radio dead spots.
-
Show morning 15-minute pre-shift on the day's specific risks — weather, expected surge times, any layout changes. Confirm who holds which authority.
-
During the event After any escalation to constrained or above, a two-minute debrief at the next natural break. What tripped it, how fast did the ladder move, what would change next time.
-
Post-event Full review of every escalation logged against the model. This is where next year's thresholds get calibrated.
That last point is the one that compounds. Your density bands are estimates the first time. Every logged escalation, with its outcome, is data that makes the next model less of a guess. Events that treat the post-event review as a formality run the same shaky model for years. Events that treat it as calibration get genuinely sharper over time.
A real scenario: a mid-size music festival
A two-day regional festival, capacity around 12,000, had run for three years with a "solid enough" crowd plan — venue-level capacity, stewards assigned to zones, a safety officer who "kept an eye on things." Year three, the second night, a headliner change pulled everyone toward the main stage faster than expected, and the single bridge connecting the two stage areas backed up badly. It didn't become an incident, but it was close. The after-action was ugly: nobody had authority to hold the bridge, the safety officer was managing a medical call at the same moment, and the density read was one steward's gut feel.
For year four they rebuilt it as an operating model. Zone-level density bands for eight zones, with the bridge modeled separately at a hard critical threshold because of its fixed width. Layered rolebook — bridge stewards could meter and hold on their own authority up to the constrained band. Escalation SLAs with a five-minute auto-escalate. Two rehearsals: a tabletop three weeks out and a physical walk-through the day before.
The bridge hit the constrained band twice on the busy night. Both times metering started within about a minute, the zone stabilized without a full hold, and the safety officer was notified but never had to take command. No crush, no pause, and the debrief afterward was a two-minute conversation instead of a post-mortem.
The change wasn't more staff — headcount was roughly the same. Everyone just knew their trigger, their authority, and their clock.
When this level of structure makes sense — and when it's overkill
Not every event needs a five-layer operating model. Building this for a 400-person conference is wasted effort, and worse, it creates process that people ignore — which trains them to ignore process generally.
This makes sense when:
-
You have real choke points — single entrances, bridges, ramps, stage-front areas
-
Attendance is in the thousands and flows aren't naturally distributed
-
You've had close calls, or your risk assessment flags crowd density as a live threat
-
You run the event repeatedly and can compound the calibration year over year
This is overkill when:
-
Small footprint, well-distributed crowd, no genuine pinch points
-
One-time event where you can't amortize the rehearsal investment
-
The venue already provides a mature crowd management system you plug into
One more caution worth stating plainly: if you can only implement one or two of the five components, be careful. Density bands with no rehearsal, or escalation SLAs with no clear rolebook authority, can be worse than an honest "we'll watch it closely" — because they create false confidence. The components only protect you as a wired loop. A partial model is a plan that looks like an operating model, which is exactly the trap this whole thing is meant to avoid.
Where the tooling actually helps
The manual version of this model is entirely doable — spreadsheets for the density math, printed rolebooks, a radio log for escalations. Plenty of good events run it that way. The friction shows up in two places: keeping the live density picture current across many zones simultaneously, and capturing escalation events cleanly enough that post-event calibration is based on real data instead of half-remembered anecdotes.
That's where an operational platform earns its place. Not by making decisions, but by keeping the monitoring layers reconciled into one view, timestamping every escalation against the model automatically, and surfacing the "constrained and rising for four minutes" state before a human notices it. The judgment stays with your stewards and safety officer, where it belongs. The tooling just makes sure the loop doesn't leak information between components — which is where the manual version usually breaks at scale.
Crowd management doesn't fail because someone lacked a good plan. It fails at the seams — where density math didn't connect to a trigger, where monitoring didn't connect to authority, where escalation didn't connect to a clock, and where none of it got rehearsed until it was reflex.
Build the components separately and you have five documents. Wire them into a loop, drill the loop until it's boring, calibrate it after every event, and you have something that actually holds when a headliner change pulls twelve thousand people the same direction at once. That loop is the operating model. Everything else is paperwork that looks reassuring right up until the moment you actually need it.
Ready to elevate your event management?
Join 5,000+ event organizers using Festoly to save time, improve coordination, and deliver memorable experiences.