

Most event teams measure retention wrong, and they measure it late. They wait until registration opens for next year, watch the returning-attendee percentage come in, and then react. By then the levers that actually moved that number were pulled — or not pulled — six to nine months earlier, mostly during the event itself and in the three weeks after it ended.
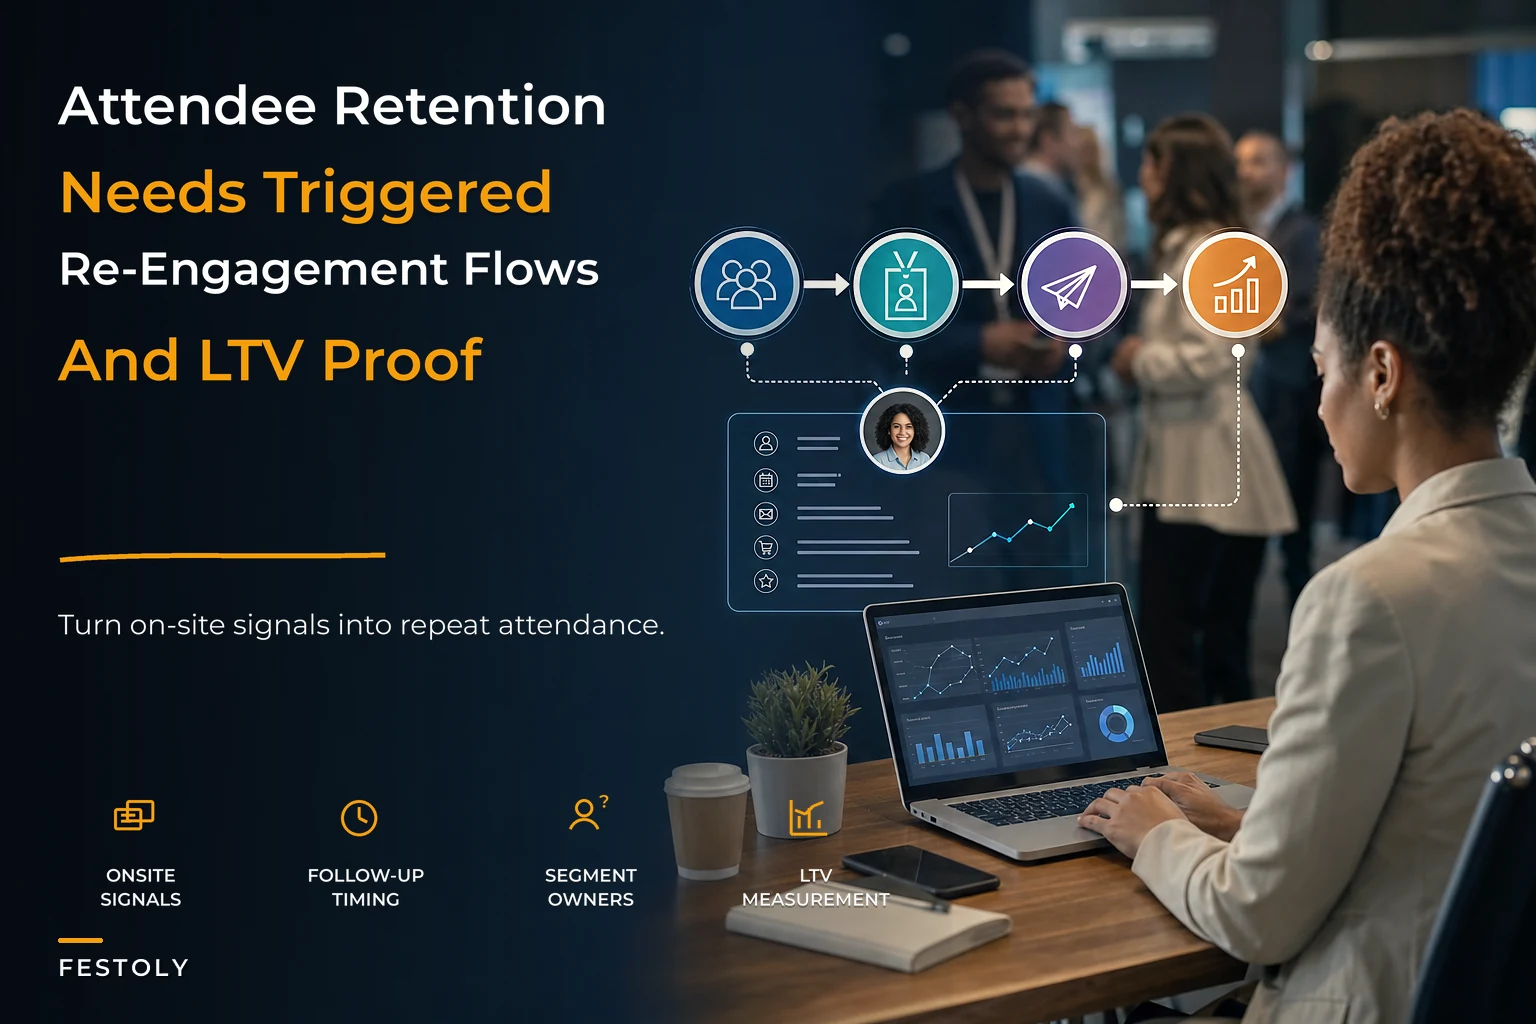
That gap between when retention is decided and when retention is measured is the core problem. Retention isn't a marketing campaign you run before the next event. It's a chain that starts at how you acquired someone, runs through what happened to them on-site, continues through whether you re-engaged them correctly based on who they actually are, and only pays off if you're measuring the right thing over multiple event cycles.
This is about connecting those pieces into one operating model instead of treating them as four separate departments who barely talk.
Why the Chain Breaks in the First Place
The typical setup has acquisition owned by marketing, on-site experience owned by operations, post-event comms owned by whoever has bandwidth, and lifetime value owned by nobody. Each group optimizes for its own metric. Marketing chases ticket volume. Ops chases a smooth day. Comms chases open rates. And because nobody owns the handoffs between them, attendees fall through the cracks at every seam.
A pattern that keeps showing up: a team spends heavily to acquire first-time attendees, delivers a genuinely good event, and then sends every single one of them the exact same "thanks for coming, here's early-bird pricing" email eleven months later. A first-timer who wandered in on a discounted ticket and a loyal five-year regular get identical treatment. One of them was never going to come back regardless. The other one just got a generic email that told them they weren't seen.
The break isn't any single email or moment. It's that information collected at one stage never travels to the stage where it would actually matter. On-site badge scans know which sessions someone attended. That data sits in a spreadsheet. The re-engagement flow that goes out months later has no idea. So the person who spent three hours in the advanced technical track and skipped the keynote gets the same "watch our keynote highlights" reel as everyone else.
The Four Stages, and What Has to Connect Them
Think of retention as one flow with four stages, each feeding the next:
Eliminate event chaos with Festoly.
Manage every aspect of your event seamlessly — from planning to execution.
- Centralized event scheduling
- Real-time attendee tracking
- Vendor & resource coordination
No credit card required
-
Acquisition — not just how many people you got, but how and why they came. Channel, price paid, referral source, first-timer vs. returning.
-
On-site experience triggers — the observable behaviors during the event that predict whether someone comes back.
-
Segmented re-engagement — the post-event communication, differentiated by who someone actually is and what they did.
-
LTV measurement — tracking value across multiple event cycles, not one.
Visualizing this flow helps teams see where handoffs fail.
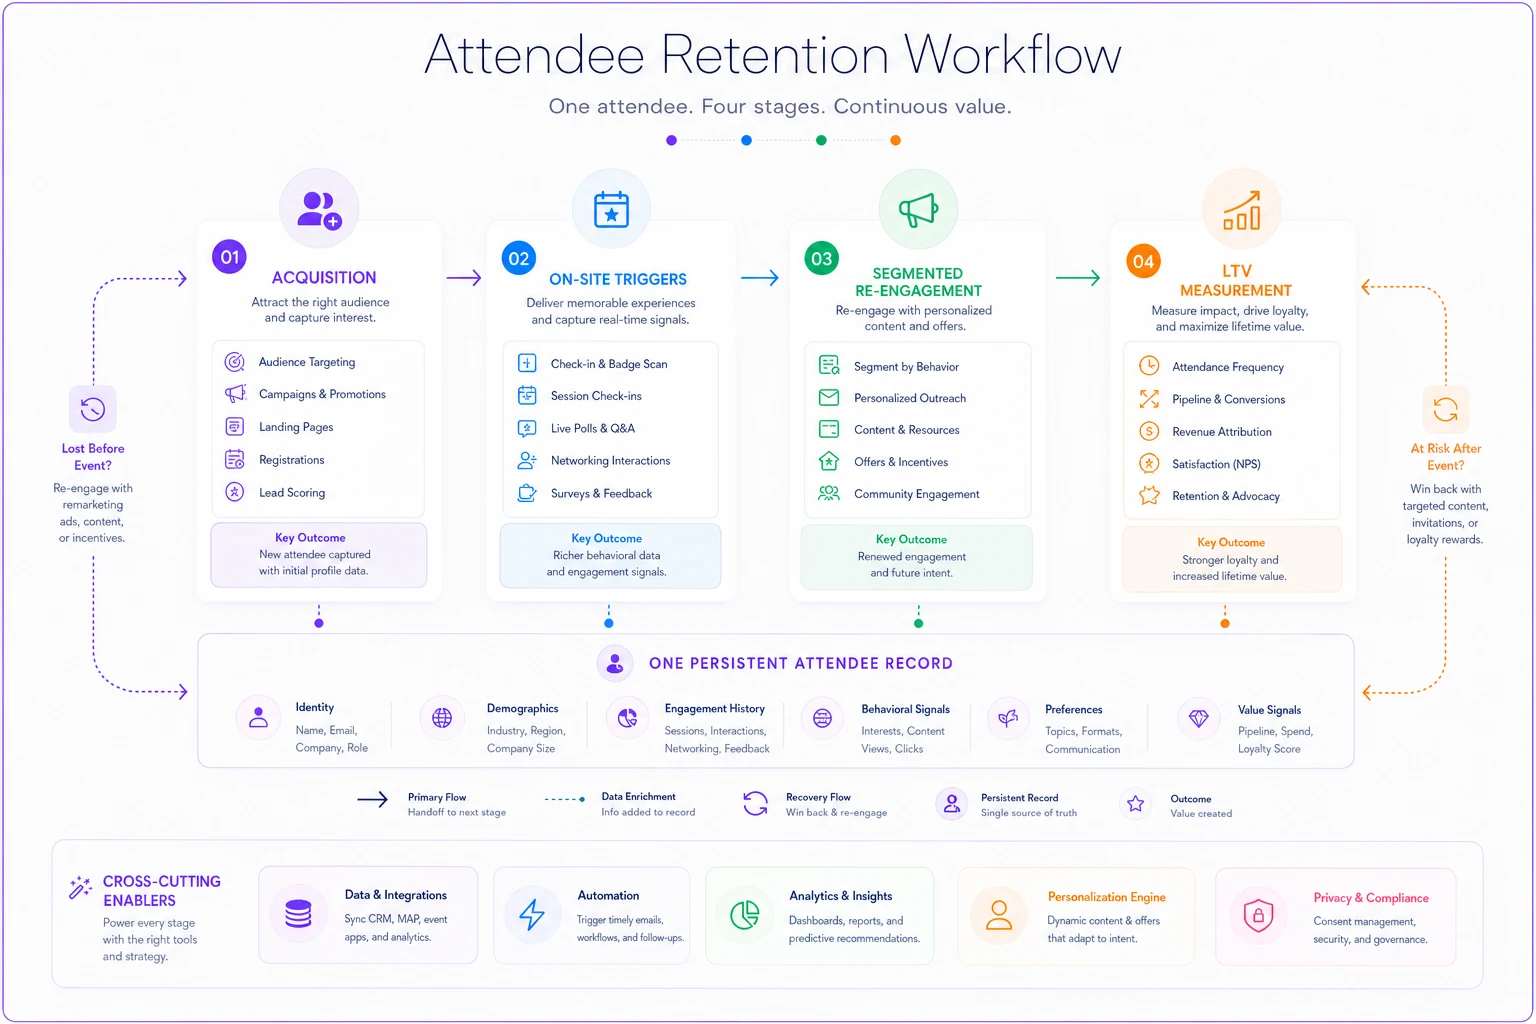
The connective tissue is a single attendee record that gets richer at every stage. If your acquisition data and your on-site data and your post-event data live in three systems that don't share a key, you don't have an operating model. You have four disconnected activities that happen to involve the same people.
A useful test: can you pull up a single attendee and see, in one place, that they came via a partner discount code in 2023, attended four sessions and spent around $80 at concessions, opened two of your five follow-up emails, then came back full-price in 2024 and brought a colleague? If you can't answer that in under two minutes, the chain is broken somewhere.
On-Site Triggers: The Signals That Actually Predict Return
The event itself is the single biggest retention lever, and it produces data most teams throw away. Certain on-site behaviors correlate strongly with whether someone comes back. The trick is deciding in advance which signals you'll capture and what each one triggers.
A few worth building around:
-
Session depth. Someone who attends three or more sessions is a fundamentally different retention prospect than someone who scanned in and left after an hour. The multi-session attendee has invested; the one-hour visitor is a churn risk worth flagging immediately.
-
Social connection. Attendees who use a networking feature, join a meetup, or get scanned at a community or lounge area retain at meaningfully higher rates. People come back for people, not content — the content they can get online.
-
On-site spend. Concession and merchandise spend is a reasonable proxy for engagement and enjoyment. A first-timer who bought a shirt is telling you something.
-
Friction events. The opposite signal. A 40-minute check-in line, a session they couldn't get into because it was full, a payment failure at a food stall — these are negative triggers, and they should route someone into a recovery flow, not a generic thank-you.
That last one matters more than people admit. A bad on-site moment doesn't just fail to build retention; it actively burns it. If your scanning and payment systems can flag a friction event in real time, you can intervene — a same-day apology, a small credit, a "we saw the line was rough, here's a fast-track pass next year." That recovers people who would otherwise silently never return.
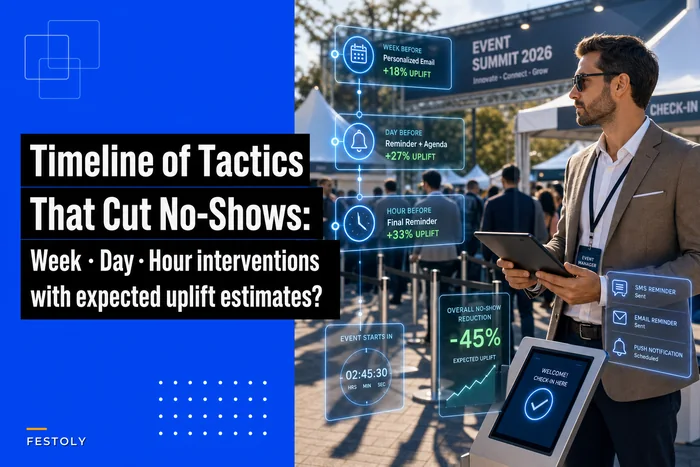
The mistake is capturing on-site data for the operations recap and never routing it into retention. Throughput numbers and dwell-time heatmaps are the same raw material that should be segmenting your follow-up. If you're already thinking hard about day-of interventions that reduce fall-off — and the week/day/hour tactics that actually cut no-shows are a solid foundation — the natural extension is treating on-site behavior as input to what happens after the event, not just a scorecard for the event itself.
Flag friction events at scan or payment so a recovery flow can trigger within 24–48 hours.
If your scanning and payment systems can flag a friction event in real time, you can intervene — a same-day apology, a small credit, a "we saw the line was rough, here's a fast-track pass next year." That recovers people who would otherwise silently never return.
Segmented Re-Engagement: Stop Sending One Email to Everyone
Once you have on-site triggers feeding an attendee record, the re-engagement flow can finally be built around real segments instead of one blast. Here's how the same population gets treated under a generic model versus a segmented one:
Here's how the same population gets treated under a generic model versus a segmented one:
| Segment | Generic model | Segmented flow | Typical result |
|---|---|---|---|
| First-timer, high engagement (3+ sessions) | Same early-bird email as everyone | "You clearly got a lot out of X track — here's what's expanding next year" + loyalty nudge | Strongest first-to-second conversion opportunity, often the biggest untapped lift |
| First-timer, low engagement (in and out) | Same early-bird email | Content-recovery flow: on-demand recordings, "here's what you missed" | Low conversion regardless, but recoverable a fraction of the time |
| Loyal returner (3+ years) | Same early-bird email | Recognition + referral ask + advisory invite | Referrals and advocacy, not just their own ticket |
| Friction-flagged attendee | Same early-bird email | Recovery flow: acknowledgment, credit, fast-track offer | Prevents silent churn from a fixable bad experience |
| Discount-only, never engages | Same early-bird email | Deprioritize or test full-price willingness | Stops overspending re-engagement effort on low-LTV people |
The generic column is what most teams run. Every row gets the same message. The segmented column only requires that you know which row someone is in — which is exactly what on-site triggers give you.
Pacing matters too. A common failure is dumping the entire re-engagement effort into one push right before registration opens. The stronger pattern spreads touches across the whole off-season: a genuine thank-you within days, something of actual value during the quiet months (a recording, a community invite, a relevant piece of content), and only then the actual sales push. Loyal returners don't need to be sold five times. A lapsed first-timer might need more warming before they'll commit.
When Heavy Segmentation Is Actually Worth It
Segmentation has a cost. Building and maintaining differentiated flows takes real time, and below a certain scale it's not worth it.
-
Under ~500 attendees Two or three segments is plenty. First-timers, returners, and friction-flagged. Don't overbuild.
-
500–5,000, single annual event This is where segmentation pays off most clearly. Enough volume that a few points of retention lift is real money, small enough that the data stays manageable.
-
Multi-event series or 5,000+ Full model. On-site triggers, five-plus segments, cross-event LTV. At this scale, skipping it leaves serious money on the table.
If you're running a small recurring meetup with a tight, known audience, don't build an eleven-segment engine. You'll spend more on the machinery than you'll ever recover. The model should scale with the event.
LTV Measurement: The Number That Ties It All Together
This is where most teams genuinely fall short. Retention gets measured as a single-year percentage — "68% of last year's attendees came back." That number is directional but nearly useless for decisions, because it hides who came back and what they're worth.
Lifetime value across event cycles is the metric that makes the whole model honest. It forces you to ask: what is a first-timer actually worth over three years, factoring in their tickets, their on-site spend, and the people they refer? Once you have that, acquisition decisions change. You might find that attendees from one referral channel have double the three-year LTV of attendees from a paid-ad channel — even though both cost roughly the same to acquire. That's a call you can only make with multi-cycle data.
A workable way to build it:
-
Assign a persistent ID to every attendee that survives across events. This is the foundation; without it, nothing else works.
-
Attach revenue at every touchpoint — ticket price actually paid, on-site spend, any add-ons — to that ID, per event.
-
Track re-attendance by cohort, grouped by how and when they were acquired.
-
Calculate rolling LTV per cohort across two to three event cycles.
-
Feed LTV back into acquisition so you spend more on the kinds of people who come back and spend, not just the cheapest tickets to fill seats.
The insight that surprises people: the highest-LTV attendees are often not the ones who paid the most for their first ticket. They're frequently the mid-engagement first-timer who had a solid experience and became a loyal, referring regular. If you only optimize acquisition for revenue-per-first-ticket, you systematically underinvest in the people who'd have been worth the most over time. Getting this attribution right is its own discipline — the ROI framework and attribution tradeoffs are worth reading if you want the measurement side to actually hold up.
A Quick Implementation Checklist
-
Every attendee has one persistent ID across events
-
Acquisition source is stored on that record (channel, price, referral)
-
On-site behavior (sessions, spend, connection, friction) is captured to the same record
-
Re-engagement flows are differentiated by at least three segments
-
Friction-flagged attendees route to a recovery flow, not the standard one
-
Re-engagement is spread across the off-season, not dumped pre-registration
-
LTV is calculated per acquisition cohort across 2+ cycles
-
LTV feeds back into next year's acquisition spending
If you're missing the persistent ID or the on-site-to-follow-up connection, fix those first. They're the two seams where the chain most commonly snaps.
A Real Scenario
A regional professional conference — roughly 2,800 attendees, single annual event — had a returning-attendee rate hovering around 55–58% year over year, which they'd assumed was just their ceiling. Every post-event follow-up went to the full list as one sequence.
They made three changes for one cycle. First, they tied badge-scan session data and concession spend back to each attendee record. Second, they split follow-up into four segments: engaged first-timers, low-engagement first-timers, multi-year returners, and anyone flagged with a check-in or payment problem on the day. Third, they moved the bulk of re-engagement into the quieter months instead of a single pre-registration blast.
The engaged-first-timer segment was the big surprise. Those people had been getting the same generic email as everyone else, and their second-year conversion had been weak. With follow-up that actually referenced the tracks they'd attended and offered a loyalty path, their return rate climbed enough to pull the overall returning-attendee rate into the mid-60s. The friction-recovery flow was small in volume but brought back a handful of people who'd had a rough check-in experience and would have otherwise quietly disappeared.
Nothing here was a dramatic revenue jump — a few points of retention, compounding, on people they'd already paid to acquire once.
Where Software Fits — and Where It Doesn't
None of this requires exotic technology, but it does require your systems to share a key. The practical bottleneck is almost always data fragmentation: registration in one platform, on-site scanning in another, email in a third, and no persistent ID connecting them.
That's the seam where operational software with AI-assisted workflows earns its place — stitching an attendee record together across acquisition, on-site, and follow-up, flagging friction events so recovery flows can fire quickly, and surfacing cohort LTV without someone rebuilding a spreadsheet every quarter. The value isn't the automation itself; it's that the chain stops breaking at the handoffs, which is where it always breaks when it's managed manually.
That said, don't buy machinery you can't feed. A 300-person meetup with a shared spreadsheet and three thoughtful segments will outperform an expensive platform there's no data volume to justify. The tooling should match the scale of the model, and the model should match the scale of the event.
Pulling It Together
Repeat attendance isn't won in the registration campaign. It's won in whether acquisition, on-site experience, re-engagement, and measurement are actually connected — whether what you learned about someone on the show floor changes what you say to them three months later, and whether you're measuring their value across years instead of guessing from a single annual percentage.
The teams that consistently grow their returning-attendee base aren't the ones with the cleverest follow-up email. They're the ones who closed the seams — who made the attendee record travel through every stage, so that by the time someone decides whether to come back, they've been treated like the specific person they are, not a line in a list.
Start with the persistent ID and the on-site-to-follow-up connection. Everything else has somewhere to plug in once those two are in place.
Start with the persistent ID and the on-site-to-follow-up connection. Everything else has somewhere to plug in once those two are in place.
Ready to elevate your event management?
Join 5,000+ event organizers using Festoly to save time, improve coordination, and deliver memorable experiences.